Updated September 1, 2017. The state averages were re-calculated and adjusted for greater accuracy.
The first few years of life can shape a child for a lifetime. Starting at birth, children reach milestones in how they play, learn, speak, act, and interact with others. Routine well-child visits and developmental screenings help families and professionals recognize milestones, monitor a child’s health, and identify possible social, behavioral and developmental delays that can be treated with early intervention services. Ongoing screening and monitoring help put kids on a path to success and give them a greater ability to learn, socialize, and thrive.
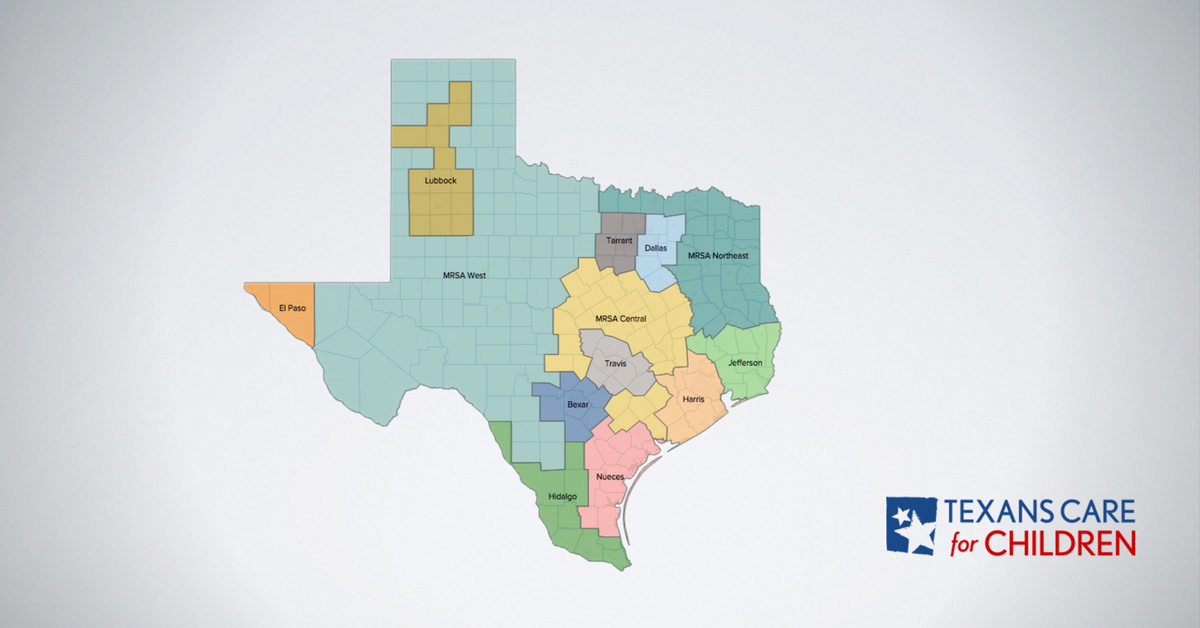
The map below shows how far each Texas region has to go to ensure that local children receive their recommended developmental screens and well-child and primary care visits. The data cover young kids enrolled in Medicaid or Children’s Health Insurance Program (CHIP) health plans in 2015.
At the state level, 55 percent of enrolled children received the recommended six or more well-child visits during the first 15 months of life. Among slightly older children, 96 percent of kids 12 months to 24 months and 90 percent of kids 25 months to 6 years had at least one visit with their primary care provider in the last year. However, not every child who visited the doctor received the recommended developmental screening. Among enrolled kids under age three, only 45 percent received a developmental screening (DVS Total). Rates varied widely across regions of Texas, particularly for developmental screenings and rate of kids receiving six or more well-child visits in first 15 months of life.
Additional Information and key findings
For additional key findings, more information about the measures on this map, and questions raised by the data, please click here.
Scroll over the map to view regional data

+ ADDITIONAL NOTES ON THE DATA AND METHODOLOGY
- Unless otherwise specified below, all measures for each service area include CHIP, STAR, and STAR+PLUS.
- For Hidalgo, MRSA Northeast, MRSA Central, and MRSA West service areas, the percentages for all measures do not include CHIP beneficiaries; these areas only include Medicaid STAR and STAR+PLUS beneficiaries.
- The W15 measure for all regions includes CHIP and STAR beneficiaries but does not include STAR+PLUS beneficiaries. This means the W15 measure for Hidalgo, MRSA Northeast, MRSA Central, and MRSA West service areas only includes STAR and does not include CHIP or STAR+PLUS.
- Data is available for Texas’ 13 managed care service areas.